Posted on
September 27th 2024
What is the carbon intensity of the electricity mix ?
All human activities have environnmental impacts, and electricity production is no exception. However, there are different methods to produce electricity and they are not all created equal : some methods, like solar power, require the extraction of a wide variety of metals ; others, like nuclear power plants, need important amounts of water to operate ; and others still, like coal power plants, emit higher levels of greenhouse gases.
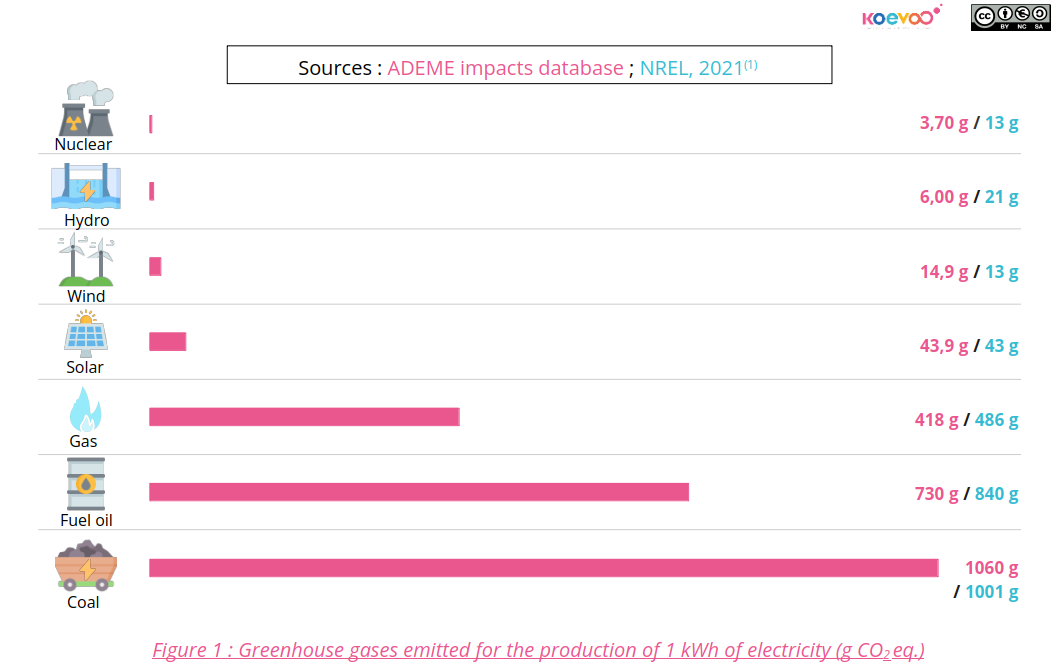
The carbon intensity of electricity relates to this last point, as it is a measure of the quantity of greenhouse gases emitted per kWh of electricty produced. It varies greatly from one method of electricity production to another : electricity generated from fossil fuel has a high carbon intensity, while renewable energies and nuclear power are low-carbon sources (Figure 1).
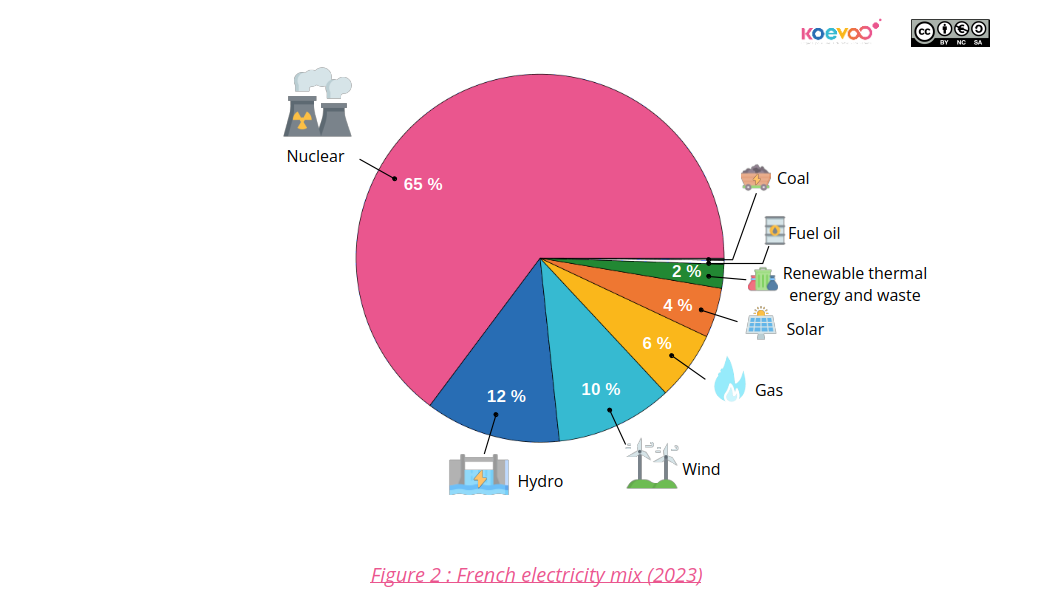
To produce its electricity, a country usually relies on a mix of different methods of production : this is called the electricity mix.
In France, electricity production relies on the mix presented in Figure 2 below :
But domestic production alone is not always enough to meet the country’s instantaneous consumption needs, which is why we import/export electricity from/to our neighboring countries, depending on wether the grid produces too little or too much electricity. Therefore, the carbon intensity of the electricity consumed over a year in France is dependent on both the domestic electricity mix and the carbon intensity of the imported electricity. In 2023, the carbon intensity of the electricity consumed in France was 53 g CO2 eq./kWh(3) on average. This is one of the lowest carbon intensities in the world. In comparison, the lowest intensity in 2023 was 16 g CO2 eq./kWh(3) for Northern Sweden, while the highest was 760 g CO2 eq./kWh(3) for Poland.
What about the digital world ?
Digital equipments consume high amounts of electricity : in France, 10% of the annual electricity consumption comes from this « sector »(4). On a global scale, if the digital sector was a country, it would be the 3rd largest consumer of electricity in the world, behind China and the USA(5). And even more so in reality, as the studies cited here were unable to gather data on certain perimeters of the « digital sector », such as equipment manufacturing, end-of-life management of these equipments, consumption of corporate networks, or the recent explosion in artificial inteligence (AI).
The result is that IT equipments (networks, user terminals and data centers) have a different impact on global warming depending on the country they’re used in. Indeed, in 2023, an IT equipment used in Northern Sweden would have 47.5 times less impact on global warming than the exact same equipment, used in the exact same way, in Poland.
Therefore, carbon intensity of the electricity mix is a key factor to consider to move towards a more sustainable use of digital technologies.
💡 Tip !
If a company claims that the carbon footprint of its electricity consumption is lower than the carbon intensity of the electricity mix of the country it is located in (location-based approach), it’s definitely greenwashing !
Some companies, for example, claim that they have a zero footprint, because they use renewable energy. However, as explained above, these energy sources may be low-carbon, but they don’t have a zero footrpint. Other companies buy Guarantees of Origin to claim « green » electricity from a particular power plant, sometimes located in another country. This approach, known as « market-based » is plain and simple greenwashing, because you can’t choose the electrons that power your equipment… unless you have your own power plant where you plug in directly. This is why, in France, Power Purchase Agreements can’t justify the replacement of the carbon intensity of the Franch electricity mix by a lower carbon intensity.
So, always check Electricity Maps to confirm companies’s claims about the environmental impact of their electricity consumption.
(1) NREL (2021). Life Cycle Greenhouse Gas Emissions from Electricity Generation: Update.
(2) éCO2mix data on cross-border trade in real time
(3) Electricity Maps data for France in 2023
(4) Less-Perasso, E., Vateau, C., & Domon, F. (2022). Evaluation de l’impact environnemental du numérique en France et analyse prospective. Technical report, ADEME et ARCEP. (2e volet, p.95)
(5) Science et Vie, august 2021
© Image d’illustration Vectorjuice, Freepik ;
Figure 1 and 2 made using icons from Konkapp and Freepik on Flaticon.
Explore the data with Koevoo :
Data for Figure 1 is from the impacts database of ADEME (Agence de la transition écologique, France) and the 2021 report of NREL (National Renewable Energy Laboratory, USA).
For the ADEME data of Figure 1, the carbon intensity of wind power comes from an unweighted average of onshore and offshore wind power. The carbon intensity of solar power is based on panels manufactured in China, which is the default value proposed by ADEME for France. These data are subject to some uncertainty (data available ont the ADEME website).
Data for Figure 1 are shown in the table below :
| Production method | ADEME data (g eq. CO2 / kWh) |
NREL data (g eq. CO2 / kWh) |
| Nuclear | 3,70 | 13 |
| Hydro | 6,00 | 21 |
| Wind | 14,9 | 13 |
| Solar | 43,9 | 43 |
| Gas | 418 | 486 |
| Fuel oil | 730 | 840 |
| Coal | 1060 | 1001 |
Data for Figure 2 comes from RTE's 2023 annual electricity review.
Other posts
Every post >Contact
Let's meet !
Thank you for reading our blog. If you wish to find out more, feel free to contact us.
Koevoo needs the contact details you provide to contact you about our products and services. You can unsubscribe from these communications at any time. See our Privacy Policy to learn more about how to unsubscribe, our privacy policies and our commitment to privacy.